Bar graph PowerPoint Presentation Templates and Google Slides
-
Stock Photo Business Strategy Examples Pie And Bar Graph Of Results Images
Plan For All Contingencies With Our Stock Photo Business Strategy Examples Pie And Bar Graph Of Results Images Powerpoint Templates. Douse The Fire Before It Catches. Generate Camaraderie With Our sales Powerpoint Templates. Good Wishes Will Come Raining Down.
-
Stock Photo Business Strategy Implementation Use Bar Graph For Result Display Icons
Good Camaraderie Is A Key To Teamwork. Our Stock Photo Business Strategy Implementation Use Bar Graph For Result Display Icons Powerpoint Templates Can Be A Cementing Force. Our business Powerpoint Templates Are An Agent Of Change. Let Your Thoughts Go Down Uncharted Courses.
-
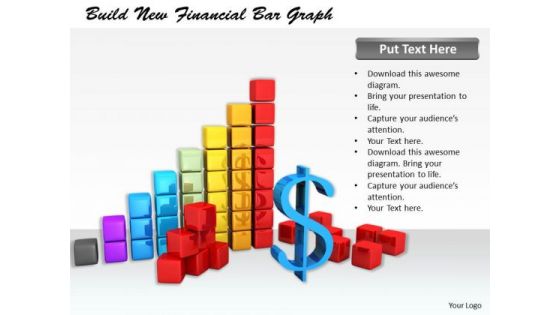
Stock Photo Business Strategy Plan Build New Financial Bar Graph Success Images
Your Grasp Of Economics Is Well Known. Help Your Audience Comprehend Issues With Our Stock Photo Business Strategy Plan Build New Financial Bar Graph Success Images Powerpoint Templates. Strike A Bargain With Our sales Powerpoint Templates. Your Thoughts Will Get A Winning Deal.
-
Stock Photo Modern Marketing Concepts See The Financial Bar Graph Business Images
Be The Dramatist With Our Stock Photo Modern Marketing Concepts See The Financial Bar Graph Business Images Powerpoint Templates. Script Out The Play Of Words. Put Our sales Powerpoint Templates Into The Draw. Your Thoughts Will Win The Lottery.
-
Stock Photo New Business Strategy Make Unique Designed Bar Graph
Add Some Dramatization To Your Thoughts. Our Stock Photo New Business Strategy Make Unique Designed Bar Graph Powerpoint Templates Make Useful Props. Draw Ahead Of Others With Our business Powerpoint Templates. Cross The Line And Win The Race.
-
Stock Photo New Business Strategy Multicolored Bar Graph
Draw Out The Best In You With Our Stock Photo New Business Strategy Multicolored Bar Graph Powerpoint Templates. Let Your Inner Brilliance Come To The Surface. Draw Out The Talents Of Your Team. Use Our success Powerpoint Templates To Give Them An Incentive.
-
Stock Photo Internet Business Strategy Make Bar With Puzzle Images And Graphics
Draw On The Experience Of Our stock photo internet business strategy make bar with puzzle stock photo images and graphics Powerpoint Templates. They Imbibe From Past Masters. Drink The Nectar Of Our Process and Flows Powerpoint Templates. Give Your Thoughts A Long Life.
-
Business Management Strategy 3d With Bar Graph Adaptable Concepts
Your ideas will do the trick. Wave the wand with our business management strategy 3d with bar graph adaptable concepts.
-
Creative Marketing Concepts 3d Man Bar Graph With Laptop Characters
Reduce The Drag With Our creative marketing concepts 3d man bar graph with laptop characters Powerpoint Templates. Give More Lift To Your Thoughts.
-
Modern Marketing Concepts 3d Man Climbing Bar Graph Adaptable Business
Discover Decisive Moments With Our modern marketing concepts 3d man climbing bar graph adaptable business Powerpoint Templates. They Help Make That Crucial Difference.
-
Stock Photo Bar Graph For Business Growth Ppt Template
Our Stock Photo Bar Graph For Business Growth PPT template Powerpoint Templates Deliver At Your Doorstep. Let Them In For A Wonderful Experience.
-
Business Concepts 3d Team Discussing Bar Graph
Put In A Dollop Of Our Business Concepts 3d Team Discussing Bar Graph Powerpoint Templates. Give Your Thoughts A Distinctive Flavor. Create Your Domain With Our marketing Powerpoint Templates. Rule Minds With Your Thoughts.
-
Stock Photo Pie Chart And Bar Graph PowerPoint Template
Put In A Dollop Of Our stock photo Pie Chart And Bar Graph powerpoint template Powerpoint Templates. Give Your Thoughts A Distinctive Flavor.
-
Stock Photo Image Of Business Bar Graph PowerPoint Template
Plan Your Storyboard With Our stock photo Image Of Business Bar Graph powerpoint template Powerpoint Templates. Give An Outline To The Solutions You Have. Give Power To Your Elbow With Our finance Powerpoint Templates. Get That Extra Information You Need.
-
Stock Photo Make New Growth Bar Graph PowerPoint Template
Your Listeners Will Never Doodle. Our Stock Photo Make New Growth Bar Graph Powerpoint Template Powerpoint Templates Will Hold Their Concentration. Do The One Thing With Your Thoughts. Uphold Custom With Our Business Powerpoint Templates.
-
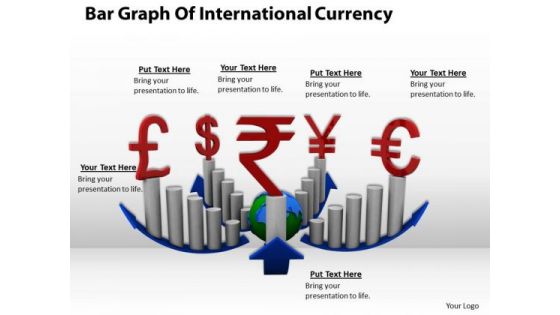
Stock Photo Bar Graph Of International Currency PowerPoint Template
Plan For All Contingencies With Our stock photo bar graph of international currency powerpoint template Powerpoint Templates. Douse The Fire Before It Catches. Generate Camaraderie With Our Globe Powerpoint Templates. Good Wishes Will Come Raining Down.
-
Business Strategy Consultants Build New Bar Graph For Marketing 3d Character Modeling
Our business strategy consultants build new bar graph for marketing 3d character modeling Powerpoint Templates Abhor Doodling. They Never Let The Interest Flag.
-
Business Strategy Formulation 3d Man Confused Bar Graph Character Modeling
Draw On The Experience Of Our business strategy formulation 3d man confused bar graph character modeling Powerpoint Templates. They Imbibe From Past Masters. Drink The Nectar Of Our Ladders Powerpoint Templates. Give Your Thoughts A Long Life.
-
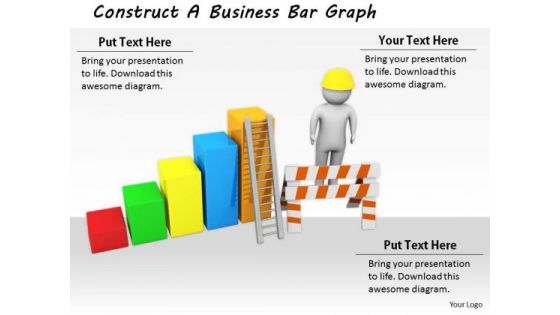
Creative Marketing Concepts 3d Man With Construction Bar Graph Characters
Our creative marketing concepts 3d man with construction bar graph characters Powerpoint Templates Are Dual Purpose. They Help Instruct And Inform At The Same Time. Collect Accolades With Our Finance Powerpoint Templates. Your Audience Will Dub You The Master.
-
Business Integration Strategy Construct Bar Graph Basic Concepts
Doll Up Your Thoughts With Our Business Integration Strategy Construct Bar Graph Basic Concepts Powerpoint Templates. They Will Make A Pretty Picture. They Say A Dog Is Man's Best Friend. Our Construction Powerpoint Templates Come A Close Second.
-
Ppt Slide Bar Graph For Growth Of Business Plan
Edit Your Work With Our PPT Slide bar graph for growth of business plan Powerpoint Templates. They Will Help You Give The Final Form. Be Your Own Editor With Our Business Plan Powerpoint Templates. Align Your Thoughts As Per Your Wishes.
-
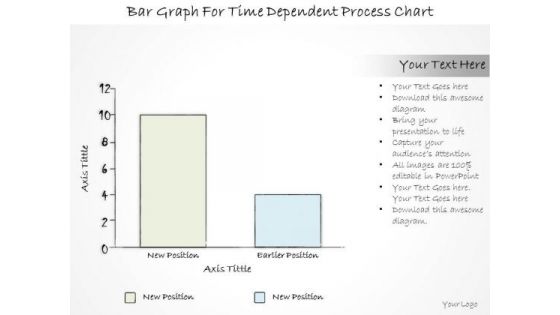
Ppt Slide Bar Graph For Time Dependent Process Chart Consulting Firms
Land The Idea With Our PPT Slide bar graph for time dependent process chart consulting firms Powerpoint Templates. Help It Grow With Your Thoughts. Cover The Compass With Our Business Plan Powerpoint Templates. Your Ideas Will Be Acceptable To All.
-
Business Cycle Diagram Eight Stages Stack Diagram Business Bar Graph Strategy Diagram
Get Out Of The Dock With Our Business Cycle Diagram Eight Stages Stack Diagram Business Bar Graph Strategy Diagram Powerpoint Templates. Your Mind Will Be Set Free.
-
Stock Photo Bar And Pie Graph For Year 2015 PowerPoint Slide
Get Out Of The Dock With Our stock photo bar and pie graph for year 2015 powerpoint slide Powerpoint Templates. Your Mind Will Be Set Free.
-
Consulting Diagram Financial Pie And Bar Graph Diagram Business Cycle Diagram
Doll Up Your Thoughts With Our Consulting Diagram Financial Pie And Bar Graph Diagram Business Cycle Diagram Powerpoint Templates. They Will Make A Pretty Picture. They Say A Dog Is Man's Best Friend. Our Consulting Diagram Financial Pie And Bar Graph Diagram Business Cycle Diagram Powerpoint Templates Come A Close Second.
-
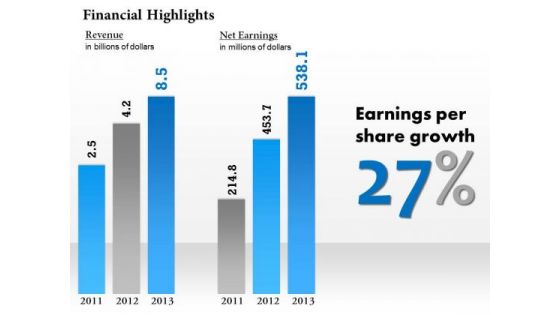
Sales Diagram Financial Result Display Bar Graph Diagram Business Framework Model
Our Sales Diagram Financial Result Display Bar Graph Diagram Business Framework Model Powerpoint Templates Deliver At Your Doorstep. Let Them In For A Wonderful Experience. Dig Out The Dope With Our Sales Diagram Financial Result Display Bar Graph Diagram Business Framework Model Powerpoint Templates. Your Thoughts Will Expose The Truth.
-
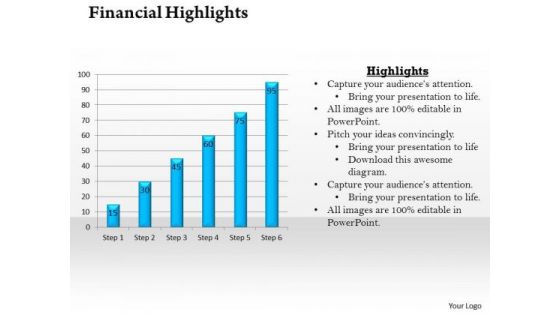
Strategic Management Bar Graph For Business And Financial Growth Business Diagram
Connect The Dots With Our Strategic Management Bar Graph For Business And Financial Growth Business Diagram Powerpoint Templates. Watch The Whole Picture Clearly Emerge. Dot Your Thoughts With Our Strategic Management Bar Graph For Business And Financial Growth Business Diagram Powerpoint Templates. Give Your Demeanor That Propel Look.
-
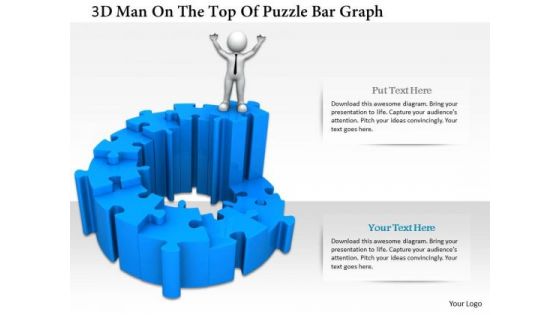
3d Man On The Top Of Puzzle Bar Graph
This PPT has been designed with graphic of 3d man and puzzle are graph. This PPT displays the concept of result analysis and financial growth. Use this PPT for your business and finance related presentations.
-
Business Diagram Bar Graph And With Growth Arrow Presentation Template
Our above diagram slide displays bar graph graph that shows relationships between different data series. Use this diagram in your presentations to get good remarks from your viewers.
-
Business Diagram Bar Graph With Different Icons For Business Presentation Template
Our above diagram slide displays bar graph graph that shows relationships between different data series. Use this diagram in your presentations to get good remarks from your viewers.
-
Business Diagram Laptop And Bar Graph Pie Chart Presentation Template
This Power Point template has been designed with graphic of target dart. This PPT diagram contains the concept of information communication. Use this PPT in your business communication related presentations.
-
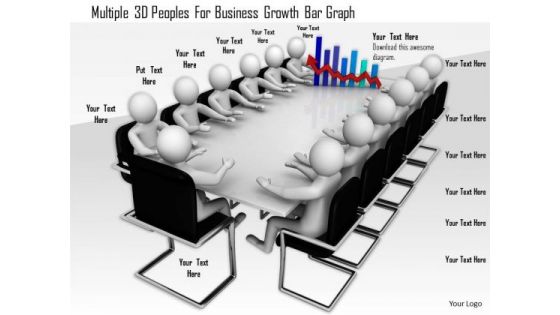
Multiple 3d Peoples For Business Growth Bar Graph
This image slide displays graphics of team meeting. This conceptual image depicts discussion on business facts and figures. Use this diagram slide to build presentation on business planning and teamwork related topics.
-
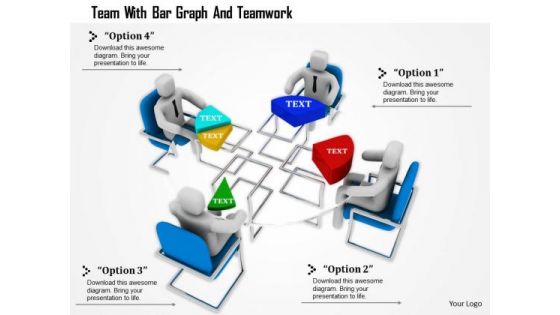
Team With Bar Graph And Teamwork
This Power Point template has been designed with graphic of 3d team forming a pie chart. In this slide team is displaying data analysis and comparison. Use this editable slide to build innovative presentation for your viewers.
-
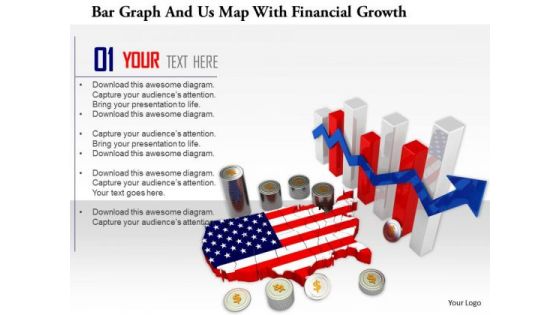
Stock Photo Bar Graph And Us Map With Financial Growth PowerPoint Slide
This image displays American map with business graph in background. This image slide contains the concept of American economy, business growth and reports. Use this amazing slide to make professional presentations.
-
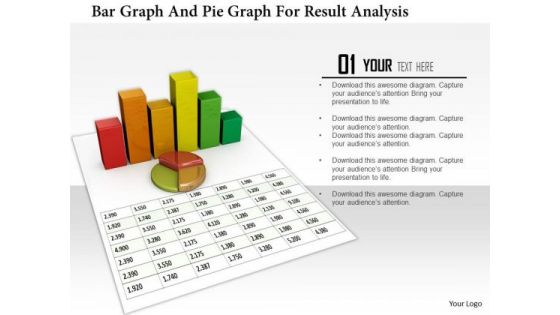
Stock Photo Bar Graph And Pie Graph For Result Analysis PowerPoint Slide
3D business graphs have been used to design this PowerPoint template. This Image slide is suitable to make business reports and charts. This slide can be used for business and marketing presentations.
-
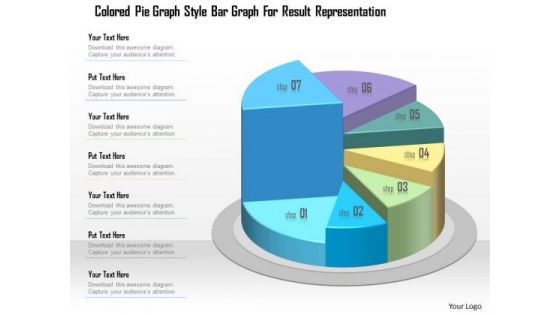
Business Diagram Colored Pie Graph Style Bar Graph For Result Representation Presentation Template
Concept of business result analysis has been displayed in this power point template. This PPT contains the colored pie graph with bar graph. Use this PPT for your business and marketing result analysis related presentations.
-
Business Diagram Eight Staged Circular Puzzle Bar Graph Presentation Template
This Power Point template has been crafted with graphic of eight staged circular puzzle and bar graph. This PPT contains the financial result analysis related concept. Use this PPT for your business and success related presentations.
-
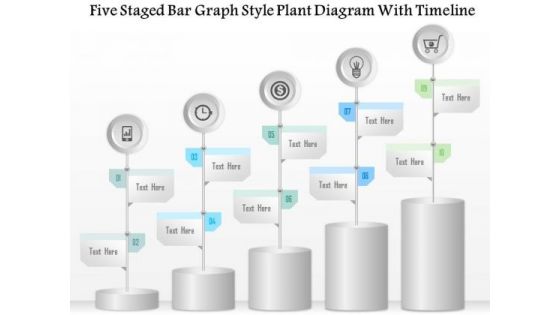
Business Diagram Five Staged Bar Graph Style Plant Diagram With Timeline Presentation Template
Five staged are graph and plant diagram has been used to design this power point template. This PPT contains the concept of business timeline. Develop new timelines for your business achievements and use this PPT for your business and finance related presentations.
-
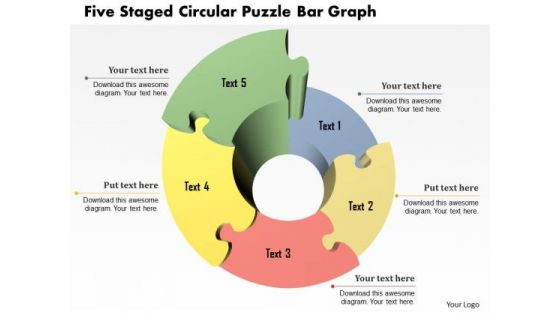
Business Diagram Five Staged Circular Puzzle Bar Graph Presentation Template
Five staged circular puzzle bar graph been used to design this power point template. This PPT contains the concept of business timeline. Show timelines for your business achievements and use this PPT for your business and finance related presentations.
-
Business Diagram Four Staged Bar Graph With Percentage Value Presentation Template
Four staged bar graph with percentage value has been used to craft this power point template. This PPT contains the concept of making financial timeline and result analysis. This PPT can be used for business and finance related presentations.
-
Stock Photo Bar Graph With Cubes For Financial Data PowerPoint Slide
Graphic of bar graph and cubes are used to decorate this image template. This PPT contains the concept of financial data analysis. Use this PPT for finance and business related presentations.
-
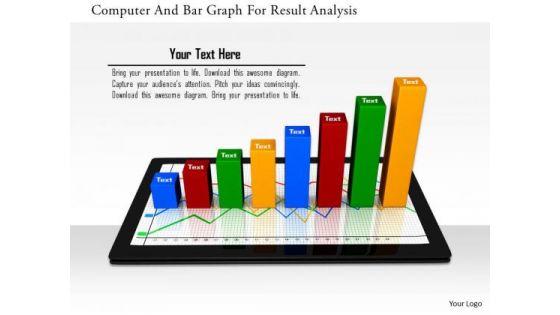
Stock Photo Computer And Bar Graph For Result Analysis PowerPoint Slide
This Power point template has been crafted with graphic of computer and bar graph. This PPT contains the concept of technology and result analysis. Use this PPT for your business and technology related presentations.
-
Business Diagram 3d Bar Graph For Business Result Analysis Presentation Template
This business slide displays five staged pie chart. This diagram is a data visualization tool that gives you a simple way to present statistical information. This slide helps your audience examine and interpret the data you present.
-
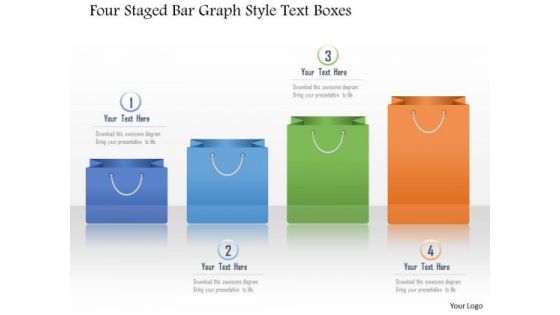
Business Diagram Four Staged Bar Graph Style Text Boxes Presentation Template
This Power Point diagram has been crafted with graphic of four shopping bags. It contains diagram of colorful shopping bag graphics depicting progress steps. Use this diagram to build professional presentation for your viewers.
-
Busines Diagram Five Staged Bar Graph For Process Flow Presentation Template
This business diagram displays graphic of five staged business info graphics. This diagram is useful to display business growth steps. Add this image in your presentations to visually support your content and express your thoughts.
-
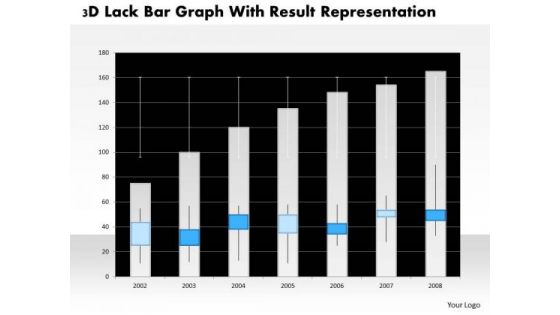
Business Diagram 3d Lack Bar Graph With Result Representation PowerPoint Slide
This business diagram has graphic of 3d lack bar graph. This diagram is a data visualization tool that gives you a simple way to present statistical information. This slide helps your audience examine and interpret the data you present.
-
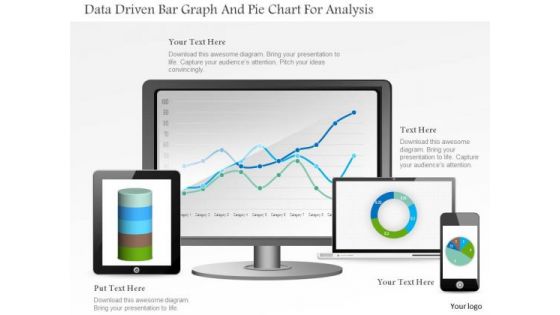
Business Diagram Data Driven Bar Graph And Pie Chart For Analysis PowerPoint Slide
This PowerPoint template displays technology gadgets with various business charts. Use this diagram slide, in your presentations to make business reports for statistical analysis. You may use this diagram to impart professional appearance to your presentations.
-
Business Diagram Tablet With Pie And Business Bar Graph For Result Analysis PowerPoint Slide
This PowerPoint template displays technology gadgets with various business charts. Use this diagram slide, in your presentations to make business reports for statistical analysis. You may use this diagram to impart professional appearance to your presentations.
-
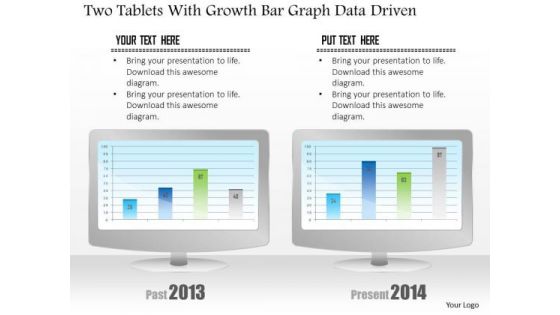
Business Diagram Two Tablets With Growth Bar Graph Data Driven PowerPoint Slide
This business diagram has been designed with comparative charts on tablets. This slide suitable for data representation. You can also use this slide to present business reports and information. Use this diagram to present your views in a wonderful manner.
-
Business Diagram Four Staged Sequential Target Bar Graph Presentation Template
This business diagram has been designed with graphic of four steps towards target achievement. Use this diagram, in your presentations to express views on strategies, policies, success, achievements and opportunities. Create professional presentations using this diagram slide.
-
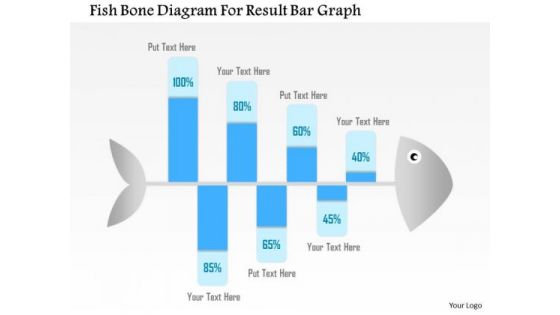
Business Diagram Fish Bone Diagram For Result Bar Graph Presentation Template
Graphic of fish bone has been used to design this Power Point template slide. This PPT slide contains the concept of problem analysis and root cause analysis. Use this PPT slide and display process of root cause analysis for any field. This PPT slide is very well designed for business and production related problem analysis.
-
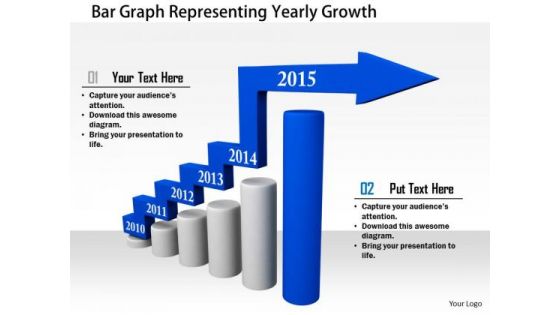
Stock Photo Bar Graph Representing Yearly Growth PowerPoint Slide
This Power Point image template slide has been crafted with graphic of bar graph and arrow. This image slide template contains the concept of yearly growth. Use this image slide and build exclusive presentation for your viewers.
-
Stock Photo Pie And Bar Graph With 2015 PowerPoint Slide
This Power Point image template slide has been crafted with graphic of pie and bar graph and 2015 year text. This PPT slide contains the concept of business and financial analysis. Use this image slide and build quality presentation for your viewers.
-
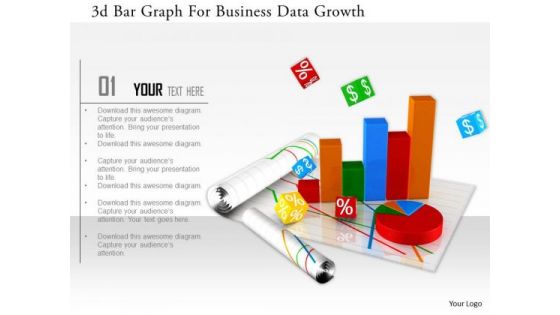
Stock Photo 3d Bar Graph For Business Data Growth Image Graphics For PowerPoint Slide
This image slide has graphics of financial charts and reports. This contains bar graph and pie chart to present business reports. Build an innovative presentations using this professional image slide.
-
Stock Photo Globe And Bar Graph For Data Analysis Image Graphics For PowerPoint Slide
This image slide has been designed with business graph with globe in background. This image slide represents topics like global business, economic growth. This image will enhance the quality of your presentations.
-
Stock Photo World Map On Bar Graph For Data Growth Image Graphics For PowerPoint Slide
This image is designed with blue graph with world map printed on it. This conceptual image portrays the concepts of global business and global economy. This image slide will help you express your views to target audience.
-
Business Diagram 3d Graphic Colored Bar Graph For Business Result Analysis Presentation Template
This Power Point template has been designed with graphic of 3d graphic and colored bar graph. Use this slide to represent six steps of any business process. Use this diagram for your business presentations and get exclusive comments on your efforts.
-
Business Diagram Bar Graph For Result Display On Mobile Presentation Template
This Power Point template has been designed with graphic of bar graph on mobile phone. This business diagram can be used to make business reports. Download this Power Point slide to build quality presentation for your viewers.
-
Business Diagram Bar Graph With Text Boxes For Data Display Presentation Template
Our above business diagram displays bar graph. It contains four steps on bar graph with icons. Use this diagram to display four stages of business growth. Download this Power Point slide to build quality presentation for your viewers.
-
Business Diagram Business Bar Graph For Data Analysis Presentation Template
This business slide displays pie charts with percentage ratios. This diagram is a data visualization tool that gives you a simple way to present statistical information. This slide helps your audience examines and interprets the data you present.


